KiwiArcTM
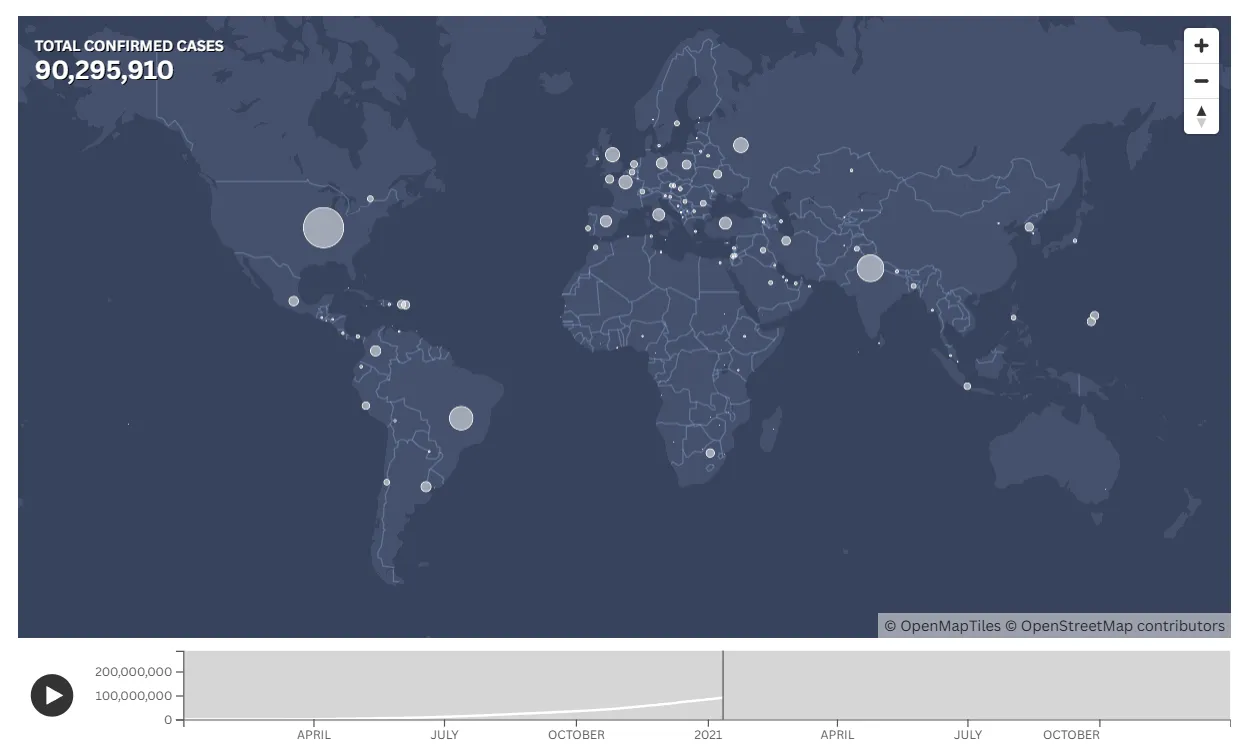
An animated global map visualizing the spread of COVID-19 cases over time, using proportional symbols and a timeline to show how reported cases changed across countries and regions.
To make the geographic and temporal progression of the pandemic easier to understand through an interactive animated map.