KiwiArcTM
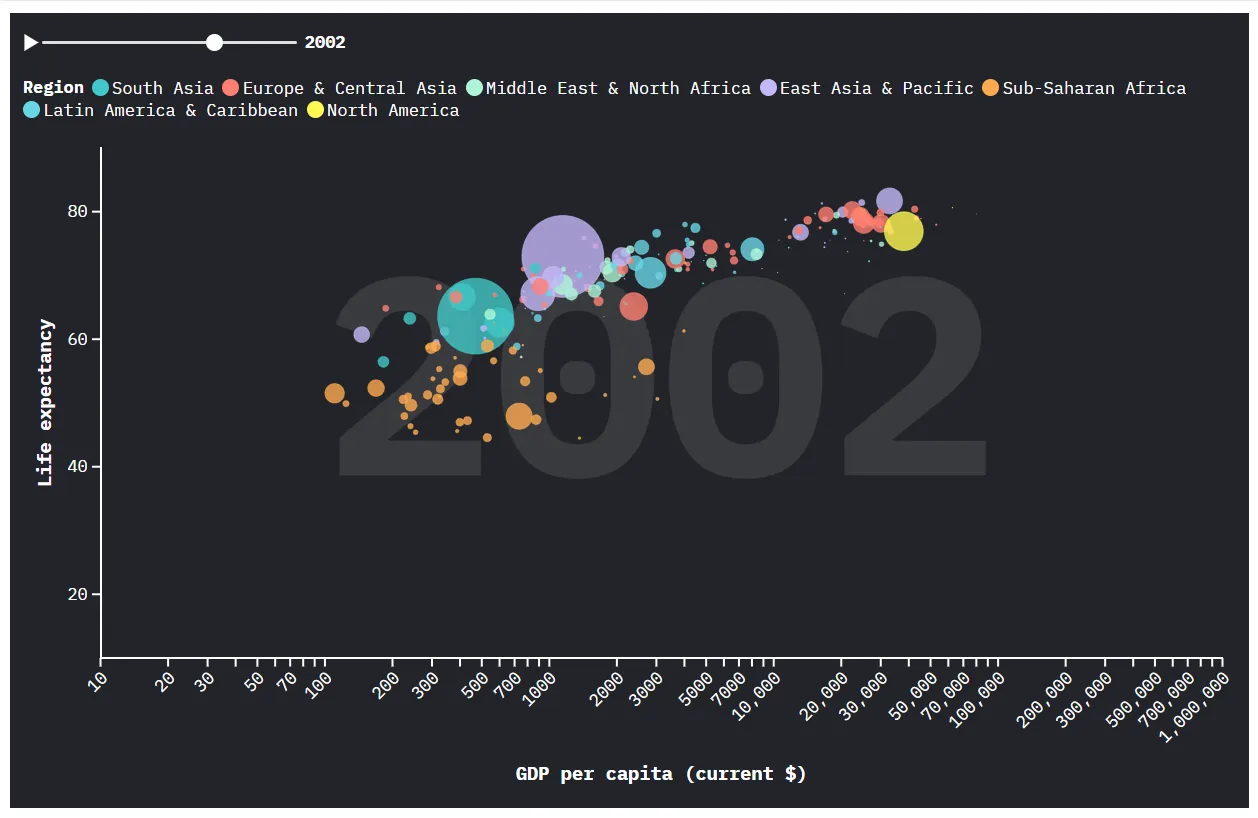
An animated bubble chart visualizing global development trends by comparing GDP per capita and life expectancy across countries and regions over time.
To make long-term socioeconomic changes easier to understand through an interactive, time-based visualization.